Logs Fundamentals– Cyber Security 101-Defensive Security -TryHackMe Walkthrough
Learn what logs are and how to analyze them for effective investigation.

Room URL: https://tryhackme.com/r/room/logsfundamentals
Task 1 Introduction to Logs
Attackers are clever. They avoid leaving maximum traces on the victim’s side to avoid detection. Yet, the security team successfully determines how the attack was executed and is even sometimes successful in finding who was behind the attack.
Suppose a few policemen are investigating the disappearance of a precious locket in a snowy jungle cabin. They observed that the wooden door of the cabin was brutally damaged, and the ceiling collapsed. There were some footprints on the snowy path to that cabin. Lastly, they discovered some CCTV footage from a neighbouring residence. By placing together all these traces, the police successfully determined who was behind the attack. Various traces are found in several such cases; putting all these together takes you closer to the criminal.
It seems like these traces play a big role in the investigations.
What if something happened within a digital device? Where do we find all these traces to investigate further?
There are various places inside a system where the traces of an attack could be fetched. The logs contain most of these traces. Logs are the digital footprints left behind by any activity. The activity could be a normal one or the one with malicious intent. Tracing down the activity and the individual behind the execution of that activity becomes easier through logs.
Use Cases of Logs
The following are some key areas in which the logs play an integral role.
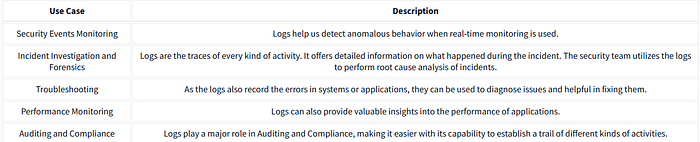
Use Case                            Description
Security                      Events Monitoring  Logs help us detect
                              anomalous behavior when
                              real-time monitoring is used.

Incident Investigation and Forensics  Logs are the traces
                                      of every kind of activity.
                                      It offers detailed information
                                      on what happened during the incident.
                                      The security team utilizes the logs to
                                      perform root cause analysis of incidents.

Troubleshooting                       As the logs also record
                                      the errors in systems or
                                      applications, they can be
                                      used to diagnose issues and helpful
                                      in fixing them.

Performance Monitoring                Logs can also provide valuable
                                      insights into the performance
                                       of applications.

Auditing and Compliance                Logs play a major role
                                       in Auditing and Compliance,
                                       making it easier with its
                                       capability to establish a
                                       trail of different kinds
                                        of activities.
This room will equip you with an understanding of various types of logs maintained in different systems. We will also be practically investigating logs as traces of different attacks.
Learning Objectives
After completing this room, you will learn about the following:
- The different types of logs
- How to analyze logs
- Analyzing Windows Event logs
- Analyzing Web Access logs
Answer the questions below
1. Where can we find the majority of attack traces in a digital system?
Answer: logs
Logs capture digital footprints of both regular activities and potentially malicious actions, making them essential for identifying and analyzing attacks.
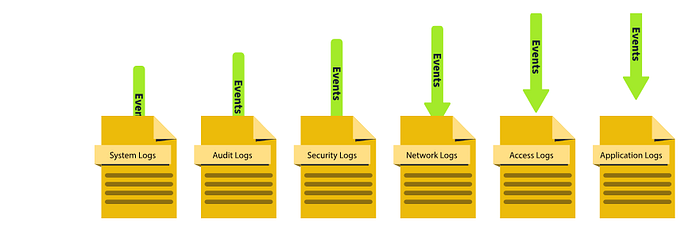
Task 2 Types of Logs
In the previous task, we saw various use cases of logs. But there is a challenge. Imagine you have to investigate an issue in a system through the logs; you open the log file of that system, and now you are lost after seeing numerous events of different categories.
Here is the solution: Logs are segregated into multiple categories according to the type of information they provide. So now you just need to look into the specific log file for which the issue relates.
For example, you need to investigate the successful logins from yesterday at a specific timeframe in Windows OS. Instead of looking into all the logs, you only need to see the system’s Security Logs to find the login information. We also have other types of logs that are useful in investigating different incidents. Let’s have a look at them.
Note: There can be various other types of logs depending on the different applications and the services they provide.
Now that we understand what these logs are and how various types of logs can be helpful in different scenarios, let’s see how we analyze these logs and extract valuable information required from them. Log Analysis is a technique for extracting valuable data from logs. It involves looking for any signs of abnormal or unusual activities. Searching for a specific activity or abnormalities in the logs with the naked eye is impossible. For this reason, we have several manual and automated techniques for log analysis. We will manually carry out log analysis on Windows and Web Server Access Logs in the upcoming tasks.
Answer the questions below
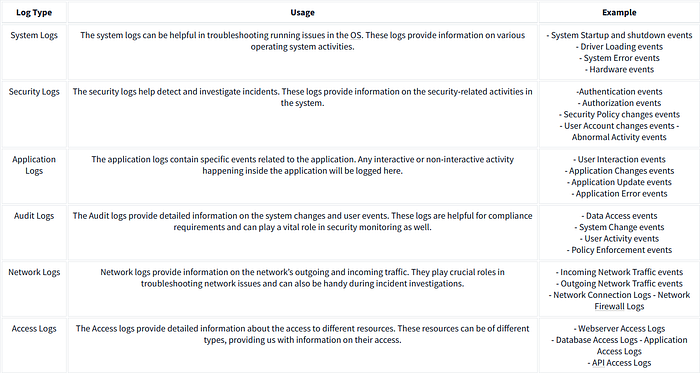
2.1 Which type of logs contain information regarding the incoming and outgoing traffic in the network?

Answer: Network Logs
Network Logs: These are logs that record all the traffic going in and out of a network. Think of it as a list showing every “visit” or “exit” through the network, similar to tracking who comes in and out of a building. Network logs help us understand what’s happening with the connections on a network, which can help in spotting anything unusual or suspicious.
2.2 Which type of logs contain the authentication and authorization events?

Answer: Security Logs
Security Logs: These logs are like a security camera for a system. They capture events related to logging in and accessing parts of the system. If someone logs in (authentication) or tries to access certain files (authorization), it gets recorded here. Security logs are essential for tracking who accessed what, making it easier to identify suspicious activities.
Task 3 Windows Event Logs Analysis
Like other operating systems, Windows OS also logs many of the activities that take place. These are stored in segregated log files, each with a specific log category. Some of the crucial types of logs stored in a Windows Operating System are:
- Application: There are many applications running on the operating system. Any information related to those applications is logged into this file. This information includes errors, warnings, compatibility issues, etc.
- System: The operating system itself has different running operations. Any information related to these operations is logged in the System log file. This information includes driver issues, hardware issues, system startup and shutdown information, services information, etc.
- Security: This is the most important log file in Windows OS in terms of security. It logs all security-related activities, including user authentication, changes in user accounts, security policy changes, etc.
Besides these, several other log files in the Windows operating system are designed for logging activities related to specific actions and applications.
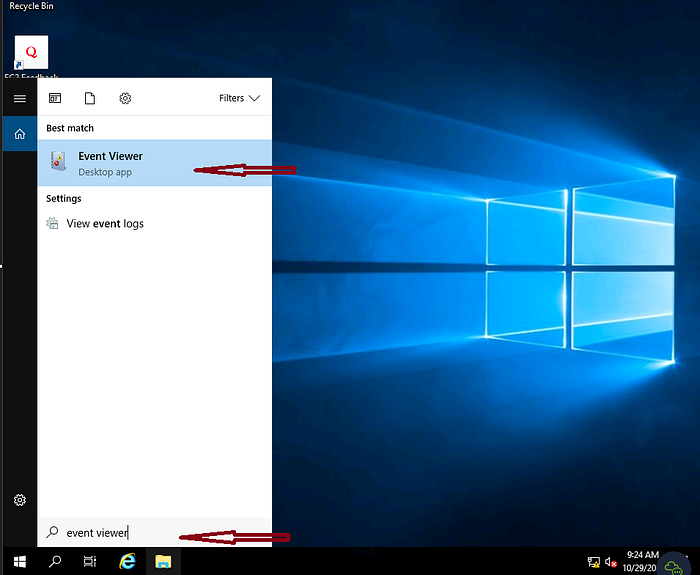
Unlike other log files studied in the previous tasks, which had no built-in application to view them, Windows OS has a utility known as Event Viewer, which gives a nice graphical user interface to view and search for anything in these logs.
To open Event Viewer, click on the Start button of Windows and type ‘Event Viewer’. It will open the Event Viewer for you, as shown below. The highlighted area in the screenshot below shows the different available logs.
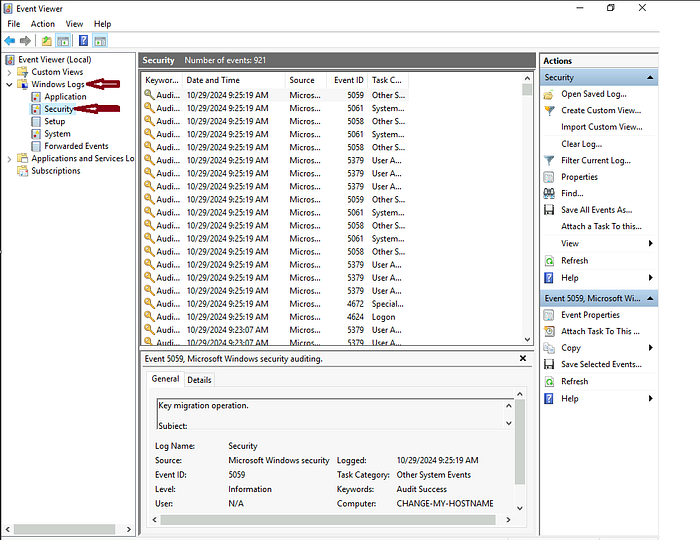
You can click ‘Windows Logs’ from the highlighted section to see the different types of logs we discussed at the beginning of this task.
The first highlighted portion shows the different log files. When we click one of these log files, we will see the different logs, as can be seen in the second highlighted portion. Lastly, in the third highlighted portion, we have different options for analyzing the logs.
Let’s double-click on one of these logs to see its contents.
This is how a Windows event log looks. It has different fields. The major fields are discussed below:
- Description: This field has a detailed information of the activity.
- Log Name: The Log Name indicates the log file name.
- Logged: This field indicates the time of the activity.
- Event ID: Event IDs are unique identifiers for a specific activity.
Numerous event IDs are available in Windows event logs. We can use these event IDs to search for any specific activity. For example, event ID 4624 uniquely identifies the activity of a successful login, so you only need to search for this event ID 4624 when investigating successful logins.
Here is a table of some important Event IDs in Windows Operating System.
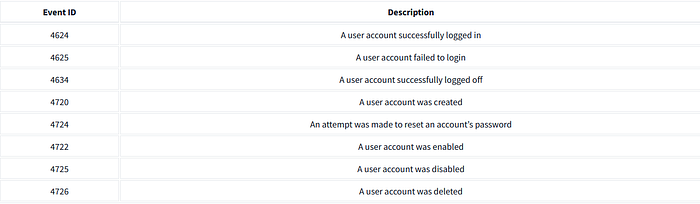
Event ID                      Description
4624                     A user account successfully logged in
4625                     A user account failed to login
4634                     A user account successfully logged off
4720                     A user account was created
4724                     An attempt was made to reset an account’s password
4722                     A user account was enabled
4725                     A user account was disabled
4726                     A user account was deleted
There are many more event IDs. It is not necessary to remember all of them, but it is good to remember the crucial event IDs.
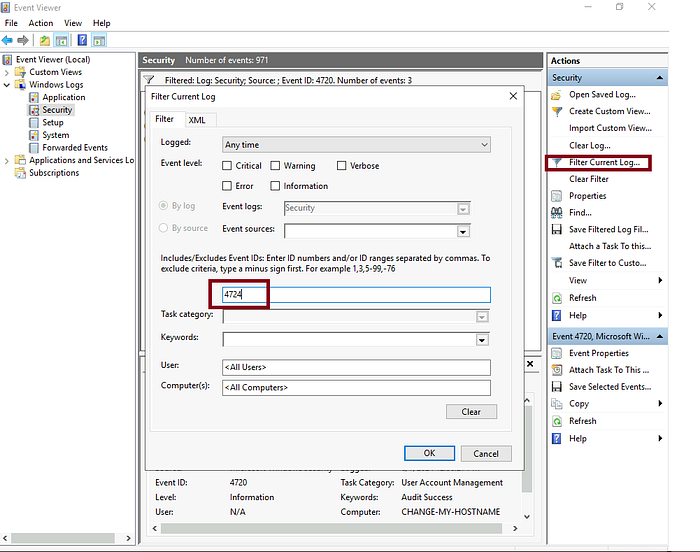
Event Viewer allows us to search for the logs related to a specific event ID with its ‘Filter Current Log’ feature. We can click on this feature to apply any filter.
When we click on the ‘Filter Current Log’ option, we will be prompted to enter the event IDs we want to filter. In the screenshot below, I filtered the event ID 4624.
Once I hit the ‘OK’ button, I can see all the logs with the event ID: 4624. I can now view any of these logs by double-clicking them.
Exercise
On Friday, a critical organization reported being a victim of a cyber attack. Upon investigation, critical data was exfiltrated from a file server in the organization’s network. The security team was successful in determining the user name and IP address of the compromised system in the network, which had access to the file server at the time of the attack.
You are tasked to find out the activities of the attacker in this compromised system before he took access to the file server.
First, let’s start the Virtual Machine by pressing the Start Machine button given below. The machine will start in Split-Screen view.
In case the VM is not visible, use the blue Show Split View button at the top of the page. The machine will open in GUI for you. You can also connect with the machine via VPN using the RDP credentials given below.

Username Administrator Password logs@123 IP MACHINE_IP
Note: All the questions below can be answered by looking into the logs.
Answer the questions below
3.1 What is the name of the last user account created on this system?
Open Event Viewer:
Click on the Start menu and type “Event Viewer” to launch the application.
Navigate to Windows Logs and select Security to view security-related logs.
Filter for Event IDs Related to User Account Activities

To identify the last created user account, filter for Event ID 4720 (indicating a new user account creation).
Click on Filter Current Log in the Security log section and enter 4720 in the Event IDs field.
Look for the most recent entry, scroll down to New Account for the name of the last user account
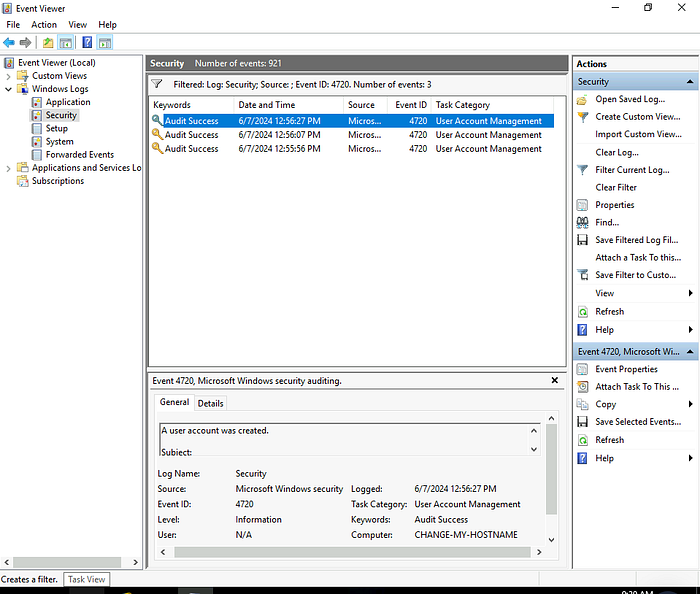
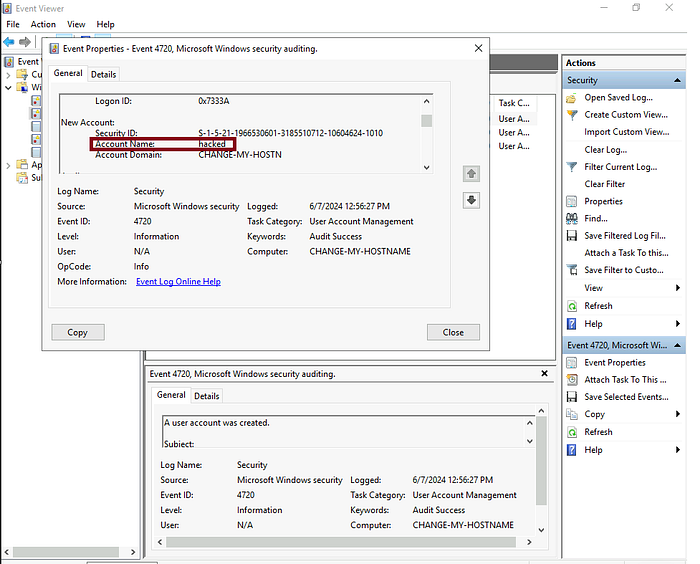
Answer: hacked
3.2 Which user account created the above account? (Question Hint See the ‘Subject’ details inside the user account creation log.)
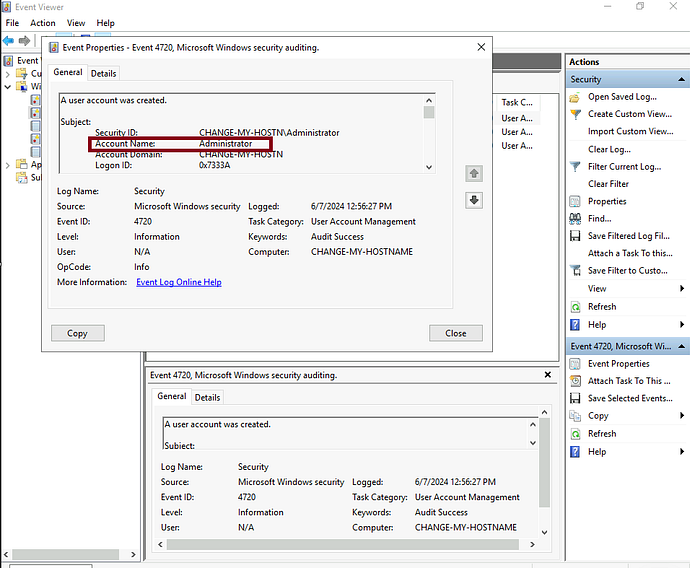
Answer:
3.3 On what date was this user account enabled? Format: M/D/YYYY
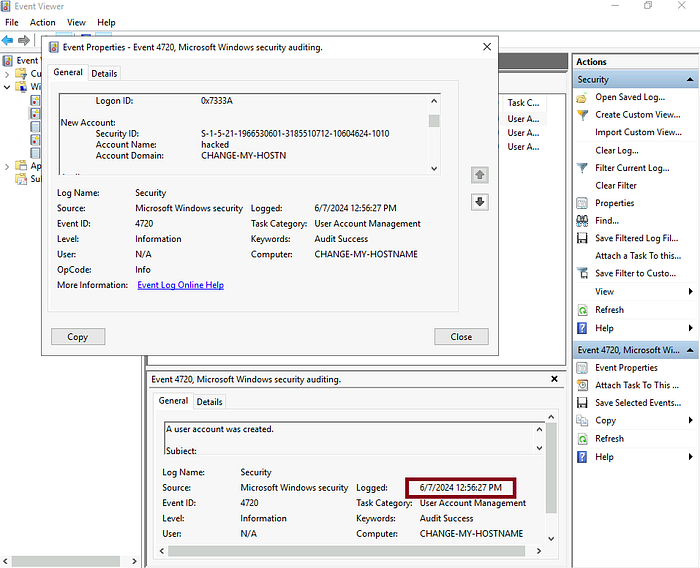
Answer:
3.4 Did this account undergo a password reset as well? Format: Yes/No
Password Reset Status: To check if the hacked account underwent a password reset, filter for Event ID 4724. If there’s an entry for the hacked account, the answer is Yes; if not, it’s No.
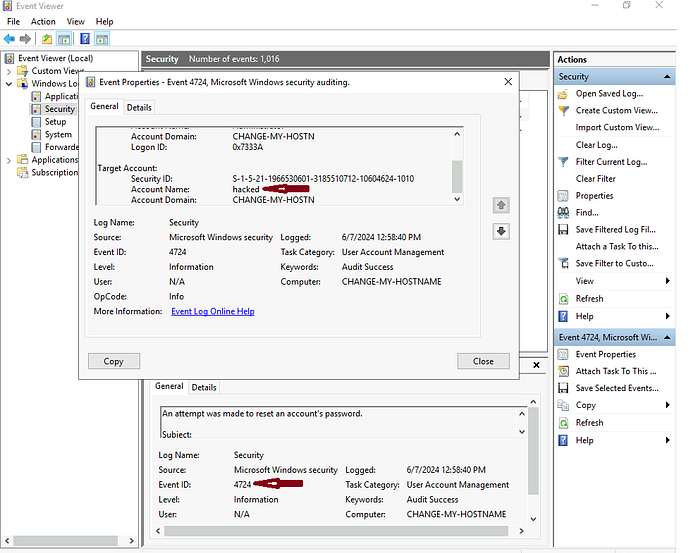
Answer: Yes
Task 4 Web Server Access Logs Analysis
We interact with many websites daily. Sometimes, we just want to view the website, and sometimes, we want to log in or upload a file into any available input field. These are just different kinds of requests we make to a website. All these requests are logged by the website and stored in a log file on the web server running that website.
This log file contains all the requests made to the website along with the information on the timeframe, the IP requested, the request type, and the URL. Following are the fields taken from a sample log from an Apache web server access log file which can be found in the directory: /var/log/apache2/access.log
- IP Address: “172.16.0.1” — The IP address of the user who made the request.
- Timestamp: “[06/Jun/2024:13:58:44]” — The time when the request was made to the website.
- Request: The request details.
- HTTP Method: “GET” — Tells the website what action to be performed on the request.
- URL: “/” — The requested resource.
- Status Code: “200” — The response from the server. Different numbers indicate different response results.
- User-Agent: “Mozilla/5.0 (Macintosh; Intel Mac OS X 10_12_3) AppleWebKit/537.36 (KHTML, like Gecko) Chrome/58.0.3029.110 Safari/537.36” — Information about the user’s Operating System, browser, etc. when making the request.
We can perform manual log analysis by using some command line utilities in the Linux operating system. The following are some commands that can be useful during manual log analysis.
cat is a popular utility for displaying the contents of a text file. We can use the cat command to display the contents of a log file, as they are typically in the text format.
cat command usage
root@kali$ cat access.log
172.16.0.1 - - [06/Jun/2024:13:58:44] "GET /products HTTP/1.1" 404 "-" "Mozilla/5.0 (Windows NT 10.0; Win64; x64) AppleWebKit/537.36 (KHTML, like Gecko) Chrome/58.0.3029.110 Safari/537.36"
10.0.0.1 - - [06/Jun/2024:13:57:44] "GET / HTTP/1.1" 404 "-" "Mozilla/5.0 (Macintosh; Intel Mac OS X 10_12_3) AppleWebKit/537.36 (KHTML, like Gecko) Chrome/58.0.3029.110 Safari/537.36"
192.168.1.1 - - [06/Jun/2024:13:56:44] "GET /about HTTP/1.1" 500 "-" "Mozilla/5.0 (Windows NT 10.0; Win64; x64) AppleWebKit/537.36 (KHTML, like Gecko) Chrome/58.0.3029.110 Safari/537.36"
Most systems rotate the logs regularly. This rotation helps them create individual log files for specific timeframes and not carry them all in a single log file. But sometimes, we may need to combine two log files. The cat command-line utility can also be helpful in this case. We can combine the results of multiple files within one single file, as shown below.
cat command usage
root@kali$ cat access1.log access2.log > combined_access.loggrep is a very useful command line utility that allows you to search for strings and patterns inside a log file. For example, you may need to search if a specific IP address is present in your log file. You can do this by using the following command: The following command will search the access.log file for the string ‘192.168.1.1’ and display all the lines with this string.
grep command usage
root@kali$ grep "192.168.1.1" access.log
192.168.1.1 - - [06/Jun/2024:13:56:44] "GET /about HTTP/1.1" 500 "-" "Mozilla/5.0 (Windows NT 10.0; Win64; x64) AppleWebKit/537.36 (KHTML, like Gecko) Chrome/58.0.3029.110 Safari/537.36"
192.168.1.1 - - [06/Jun/2024:13:53:44] "GET /products HTTP/1.1" 404 "-" "Mozilla/5.0 (Windows NT 10.0; Win64; x64) AppleWebKit/537.36 (KHTML, like Gecko) Chrome/58.0.3029.110 Safari/537.36"
192.168.1.1 - - [06/Jun/2024:13:46:44] "GET /about HTTP/1.1" 200 "-" "Mozilla/5.0 (Windows NT 10.0; Win64; x64) AppleWebKit/537.36 (KHTML, like Gecko) Chrome/58.0.3029.110 Safari/537.36"
The less command is helpful for handling multiple log files. You may need to analyze specific chunks one by one. For this, you can use the less command-line utility, which helps you view one page at a time.
less command usage
root@kali$ less access.log
172.16.0.1 - - [06/Jun/2024:13:52:44] "GET /products HTTP/1.1" 404 "-" "Mozilla/5.0 (Windows NT 6.1; Win64; x64) AppleWebKit/537.36 (KHTML, like Gecko) Chrome/58.0.3029.110 Safari/537.36"
10.0.0.1 - - [06/Jun/2024:13:48:44] "GET /about HTTP/1.1" 404 "-" "Mozilla/5.0 (Windows NT 6.1; Win64; x64) AppleWebKit/537.36 (KHTML, like Gecko) Chrome/58.0.3029.110 Safari/537.36"
192.168.1.1 - - [06/Jun/2024:13:46:44] "GET /about HTTP/1.1" 200 "-" "Mozilla/5.0 (Windows NT 10.0; Win64; x64) AppleWebKit/537.36 (KHTML, like Gecko) Chrome/58.0.3029.110 Safari/537.36"
:
Use spacebar to move to the next page and b to the previous page.
After running this command, the logs would be displayed in pages, one after one, making it easy for manual analysis. If you wish to search for something in the logs, you can type / followed by the pattern you are searching for and hit enter.
Use n to navigate to the next occurrence of your search and N to navigate to the previous occurrence of your search.
A sample web server access log file is given in this task. Download the file by clicking the button “Download Task Files” below.
However, we have also added the log file to the AttackBox for your convenience. To follow along, press the Start AttackBox button at the top of the page. The AttackBox will open in split view. If it is not showing up, you can press the Show Split View button at the top of the page. You can find the “access.log” file in the following directory: /root/Rooms/logs
Use the manual log analysis commands discussed above to answer the questions given below.
Note: If you are downloading the log file for the analysis, some browsers like Chrome would block downloading it because it contains IP addresses, URLs, and User agent strings that may be flagged as malicious by their security mechanisms. You can click “Keep file” or any other alternative option available in your browser after it blocks the download.
Answer the questions below
4.1 What is the IP which made the last GET request to URL: “/contact”?
Open the AttackBox and navigate to the directory with the access.log file
and List the content

cd /root/Rooms/logs
ls
view file contents
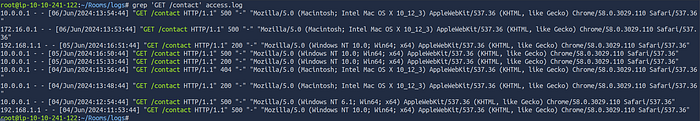
grep 'GET /contact' access.logsearch for GET Requests to “/contact”: By scanning through the log entries, look specifically for lines that contain both GET and /contact.
Check Timestamps: The logs are generally displayed in chronological order (from top to bottom, with the most recent entries at the bottom). So, by finding the last occurrence of GET /contact, we can identify the latest IP that accessed this URL using the GET method.
Identify the Last Occurrence: In the screenshot, we observe the following entries:
There are multiple requests to /contact with different timestamps.
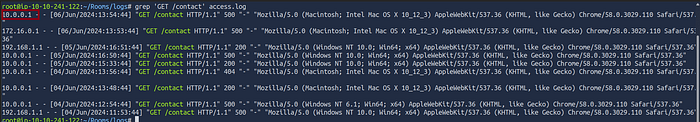
The last GET /contact entry has the IP 10.0.0.1 and a timestamp of 06/Jun/2024:13:54:44.
This entry confirms that 10.0.0.1 was the last IP to make a GET request to /contact based on the logs provided in the screenshot.
Answer: 10.0.0.1
4.2 When was the last POST request made by IP: “172.16.0.1”?
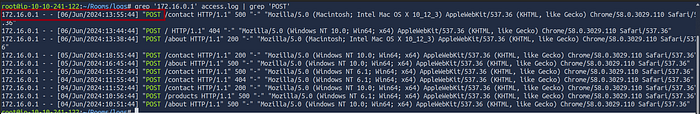
grep '172.16.0.1' access.log | grep 'POST' Log Entry
IP Address: 172.16.0.1 — This is the IP address making the request.
Timestamp: [06/Jun/2024:13:55:44] — This shows the exact date and time of the request.
Request Type: “POST /contact HTTP/1.1” — The request method is POST, and the target URL is /contact.
Status Code: 500 — This is the HTTP response code, indicating a server error in this case.
Answer: 06/Jun/2024:13:55:44
4.3 Based on the answer from question number 2, to which URL was the POST request made?
Answer: /contact
Task 5 Conclusion
In this room, we learned about how logs are an important source of information during an investigation. We studied the different types of logs and their use cases and learned how to analyze them manually and automatically.
The practical exercises of Windows Event Log Analysis and Web Server Access Log Analysis in the previous tasks gave you an opportunity to work on the log files from different incident scenarios.
Answer the questions below
Complete the room.